class URLSessionclass URLSessionTask Technology
The HTTP Traffic instrument is part of Instruments, a performance-analysis and testing tool for iOS, iPadOS, watchOS, tvOS, and macOS apps. The instrument intercepts, records, and visualizes both encrypted and non-encrypted HTTP traffic. It internally gathers detailed information — including header and body content, connection setup duration, and request and response times — from the URL Loading System. It then records this data and recombines it into precise intervals with additional metadata.
Important 重要
This instrument records both encrypted and unencrypted HTTP traffic of targeted processes in the trace document and in system logs, in an unencrypted state. When sharing trace documents and log files from the target device, be aware that they may contain sensitive information.
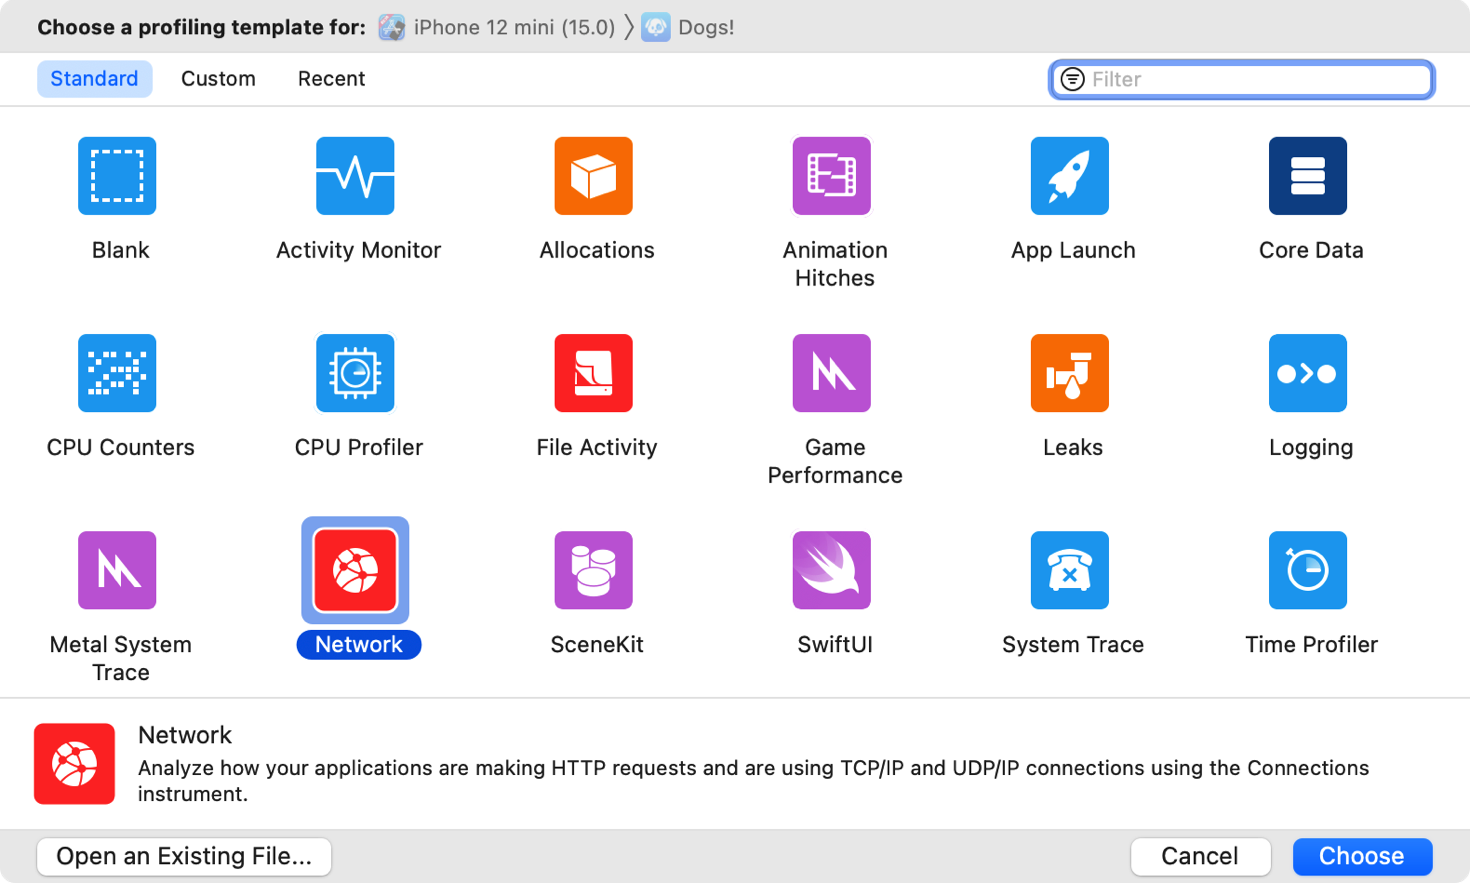
From Xcode’s Product menu, choose Profile. After Instruments launches, select the Network template, then click Choose.
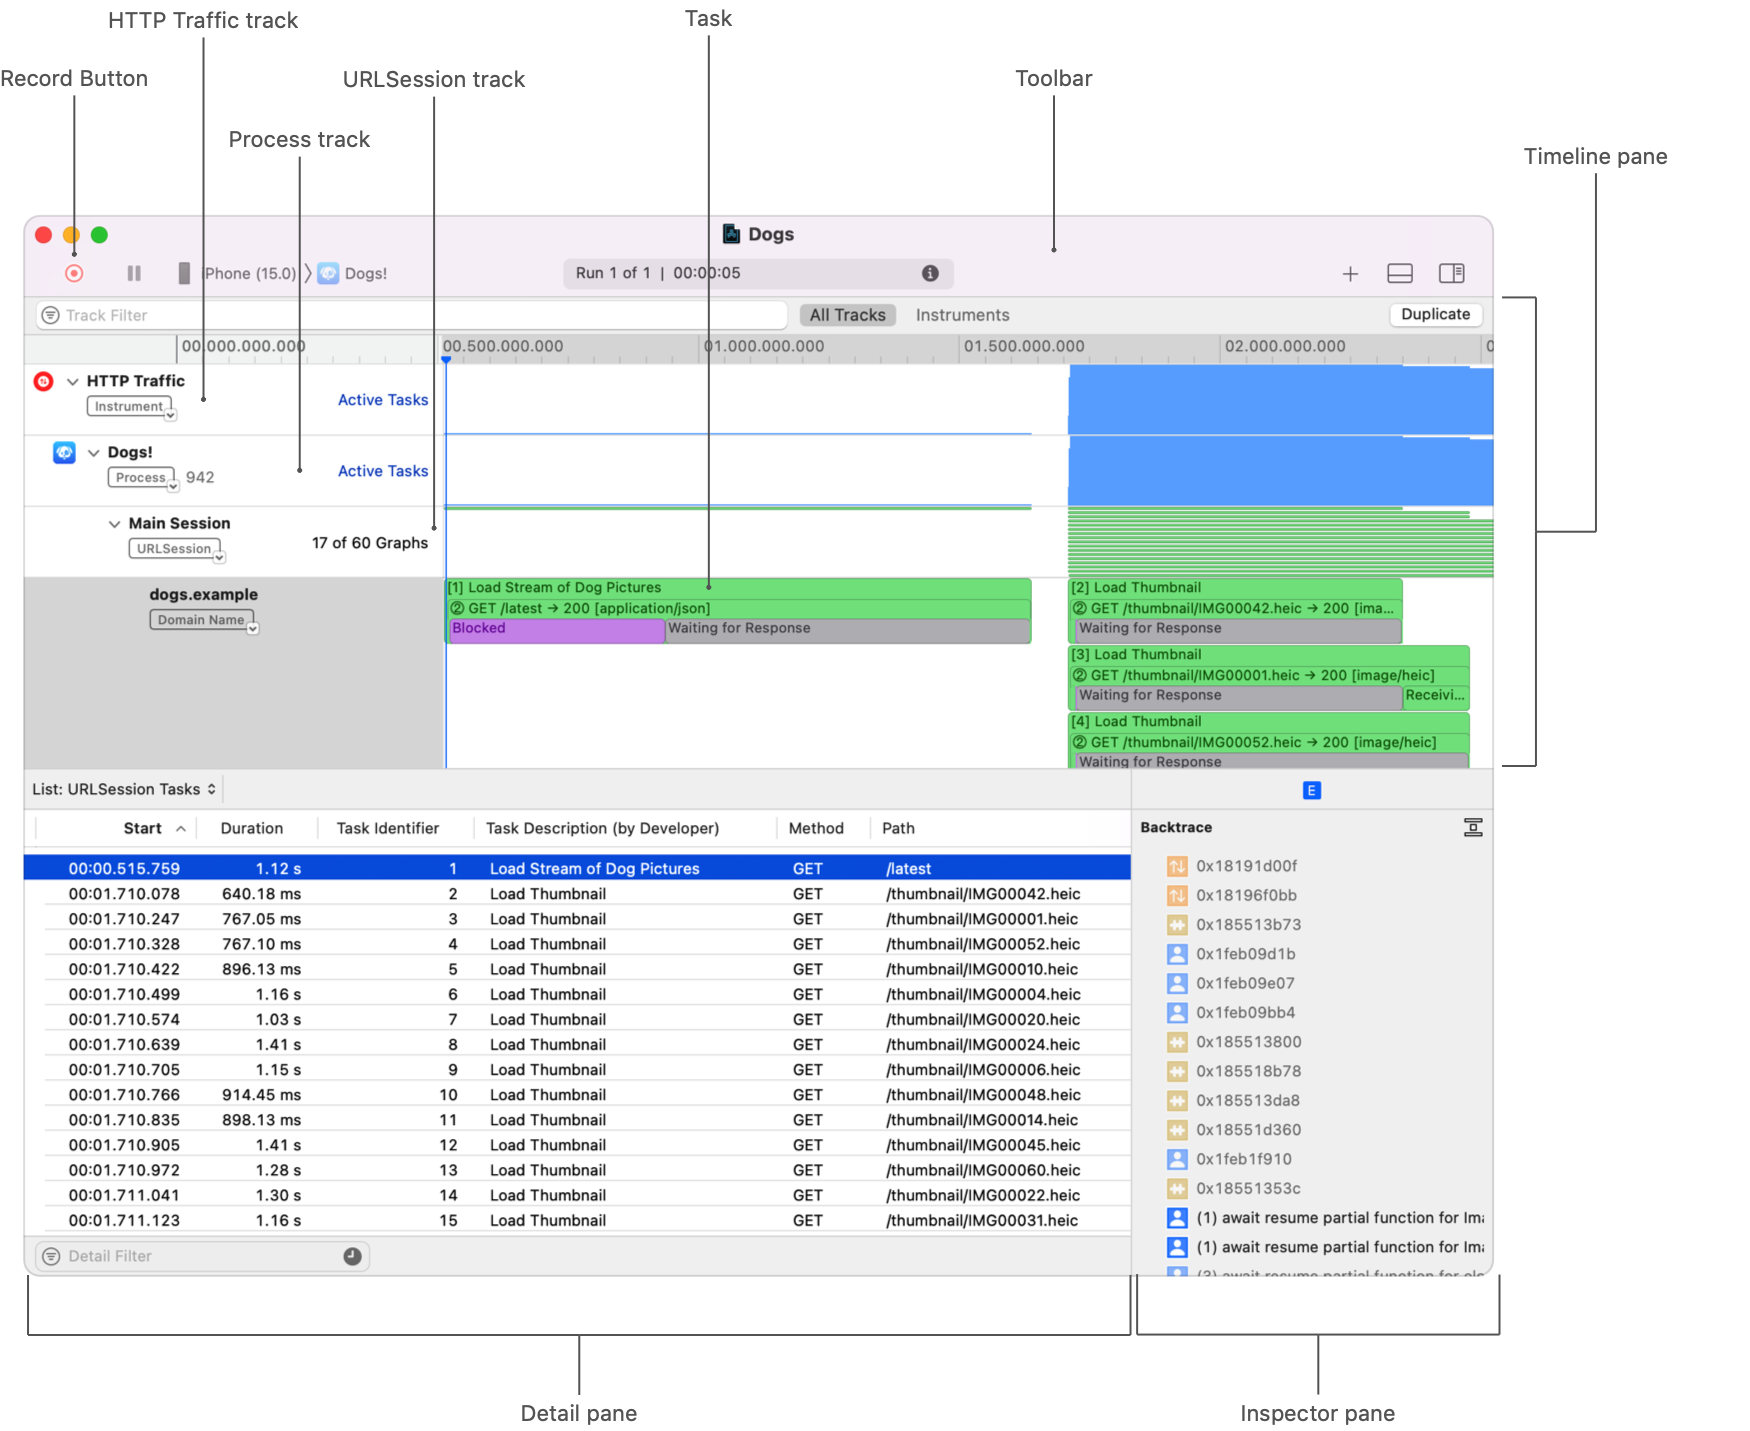
The Network Connections and HTTP Traffic instruments appear in a new window, along with the timeline and detail panes. The following figure highlights the areas of interest.
Click the Record button in the toolbar. A dialog appears that explains the risks associated with capturing HTTP traffic and storing it unencrypted. If you accept this risk, click Record Anyway. The app launches and the instrument starts monitoring.
The HTTP Traffic track is the topmost track. It shows all HTTP traffic for the current recording session. You can also view a break down of the captured traffic across different dimensions using a hierarchy of the HTTP Traffic instrument subtracks. To reveal the subtracks, click the disclosure triangle next to HTTP Traffic.
The first hierarchy level organizes the traffic by process, revealing one track per captured process. Each process contains one or more URLSession tracks, and each session contains a set of one or more domain tracks.
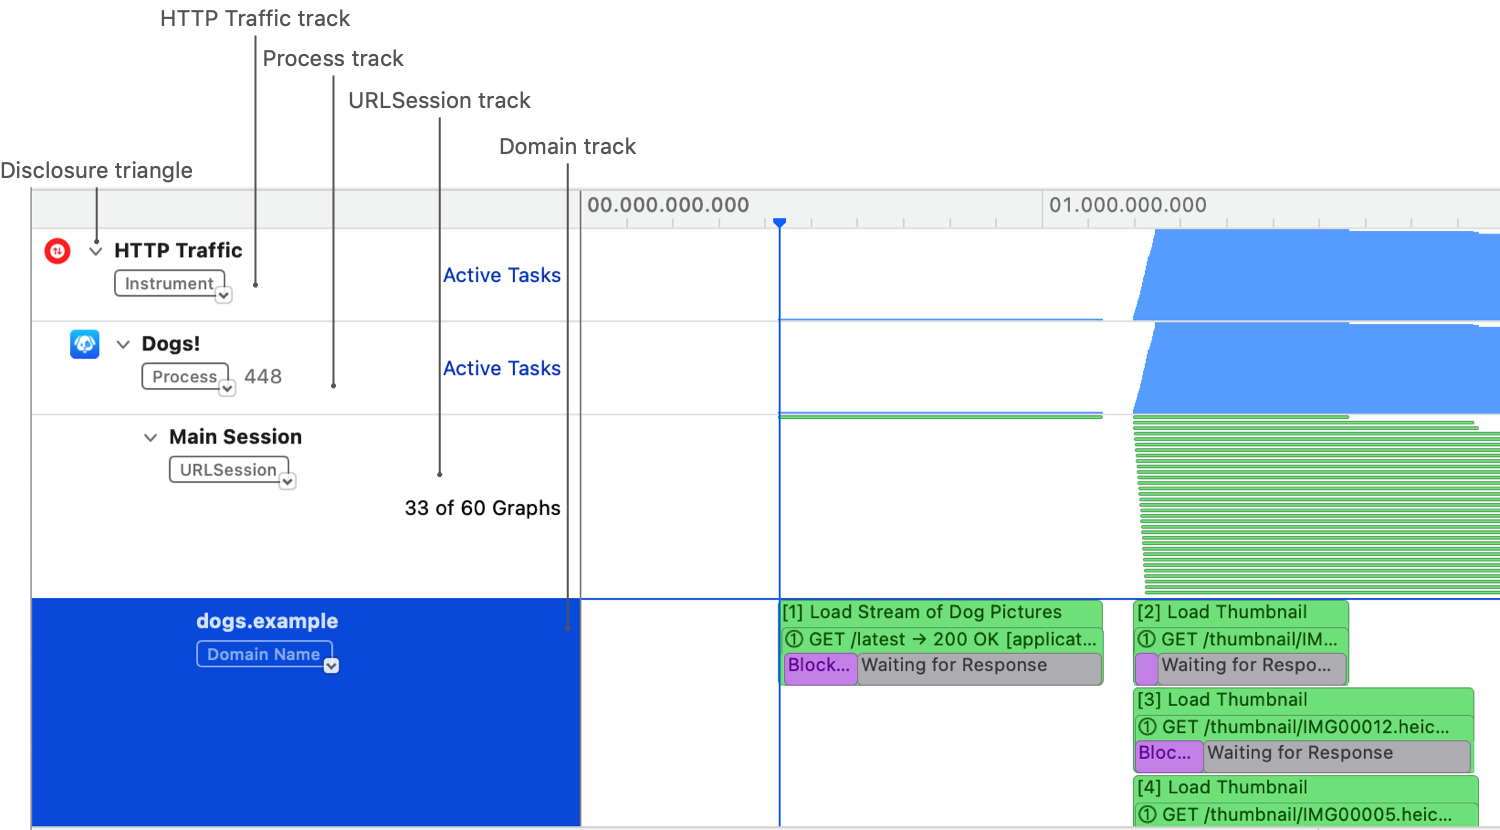
The HTTP Traffic track and the process tracks show an aggregated view that displays how many tasks or transactions are active at any point. Session tracks display individual intervals for each task and transaction.
A session track corresponds to a URLSession that you create in code. The session name comes from the session property. Naming your session allows you to reference it when viewing HTTP traffic for your app. Here’s an example showing how to name a session:
let session = URLSession(configuration:.default)
session.sessionDescription = "Main Session"There are times when completing a URLSession task requires several rounds of requests and responses. Each pair of requests and responses is a transaction.
Domain tracks provide an increased level of detail. In addition to information about the task, they also display the underlying transactions and transaction states. Here’s the dogs.example domain track showing a task with two transactions.

A transaction has five states that occur in the following order: cache lookup, blocked, sending request, waiting for response, and receiving response. The following illustration shows these states.

Some states have a very short duration compared to others. For example, cache lookup may take a few milliseconds, whereas blocking occurs for a second or longer. This leads to the cache lookup state not being visible at the default zoom level. If you’d like to view a specific state, use your mouse or trackpad to zoom in to the corresponding area of the transaction to reveal more information.
Instruments provides two display styles in the track area. The default display style shows a list of URLSession tasks. Here are the tasks for the dogs.example session.
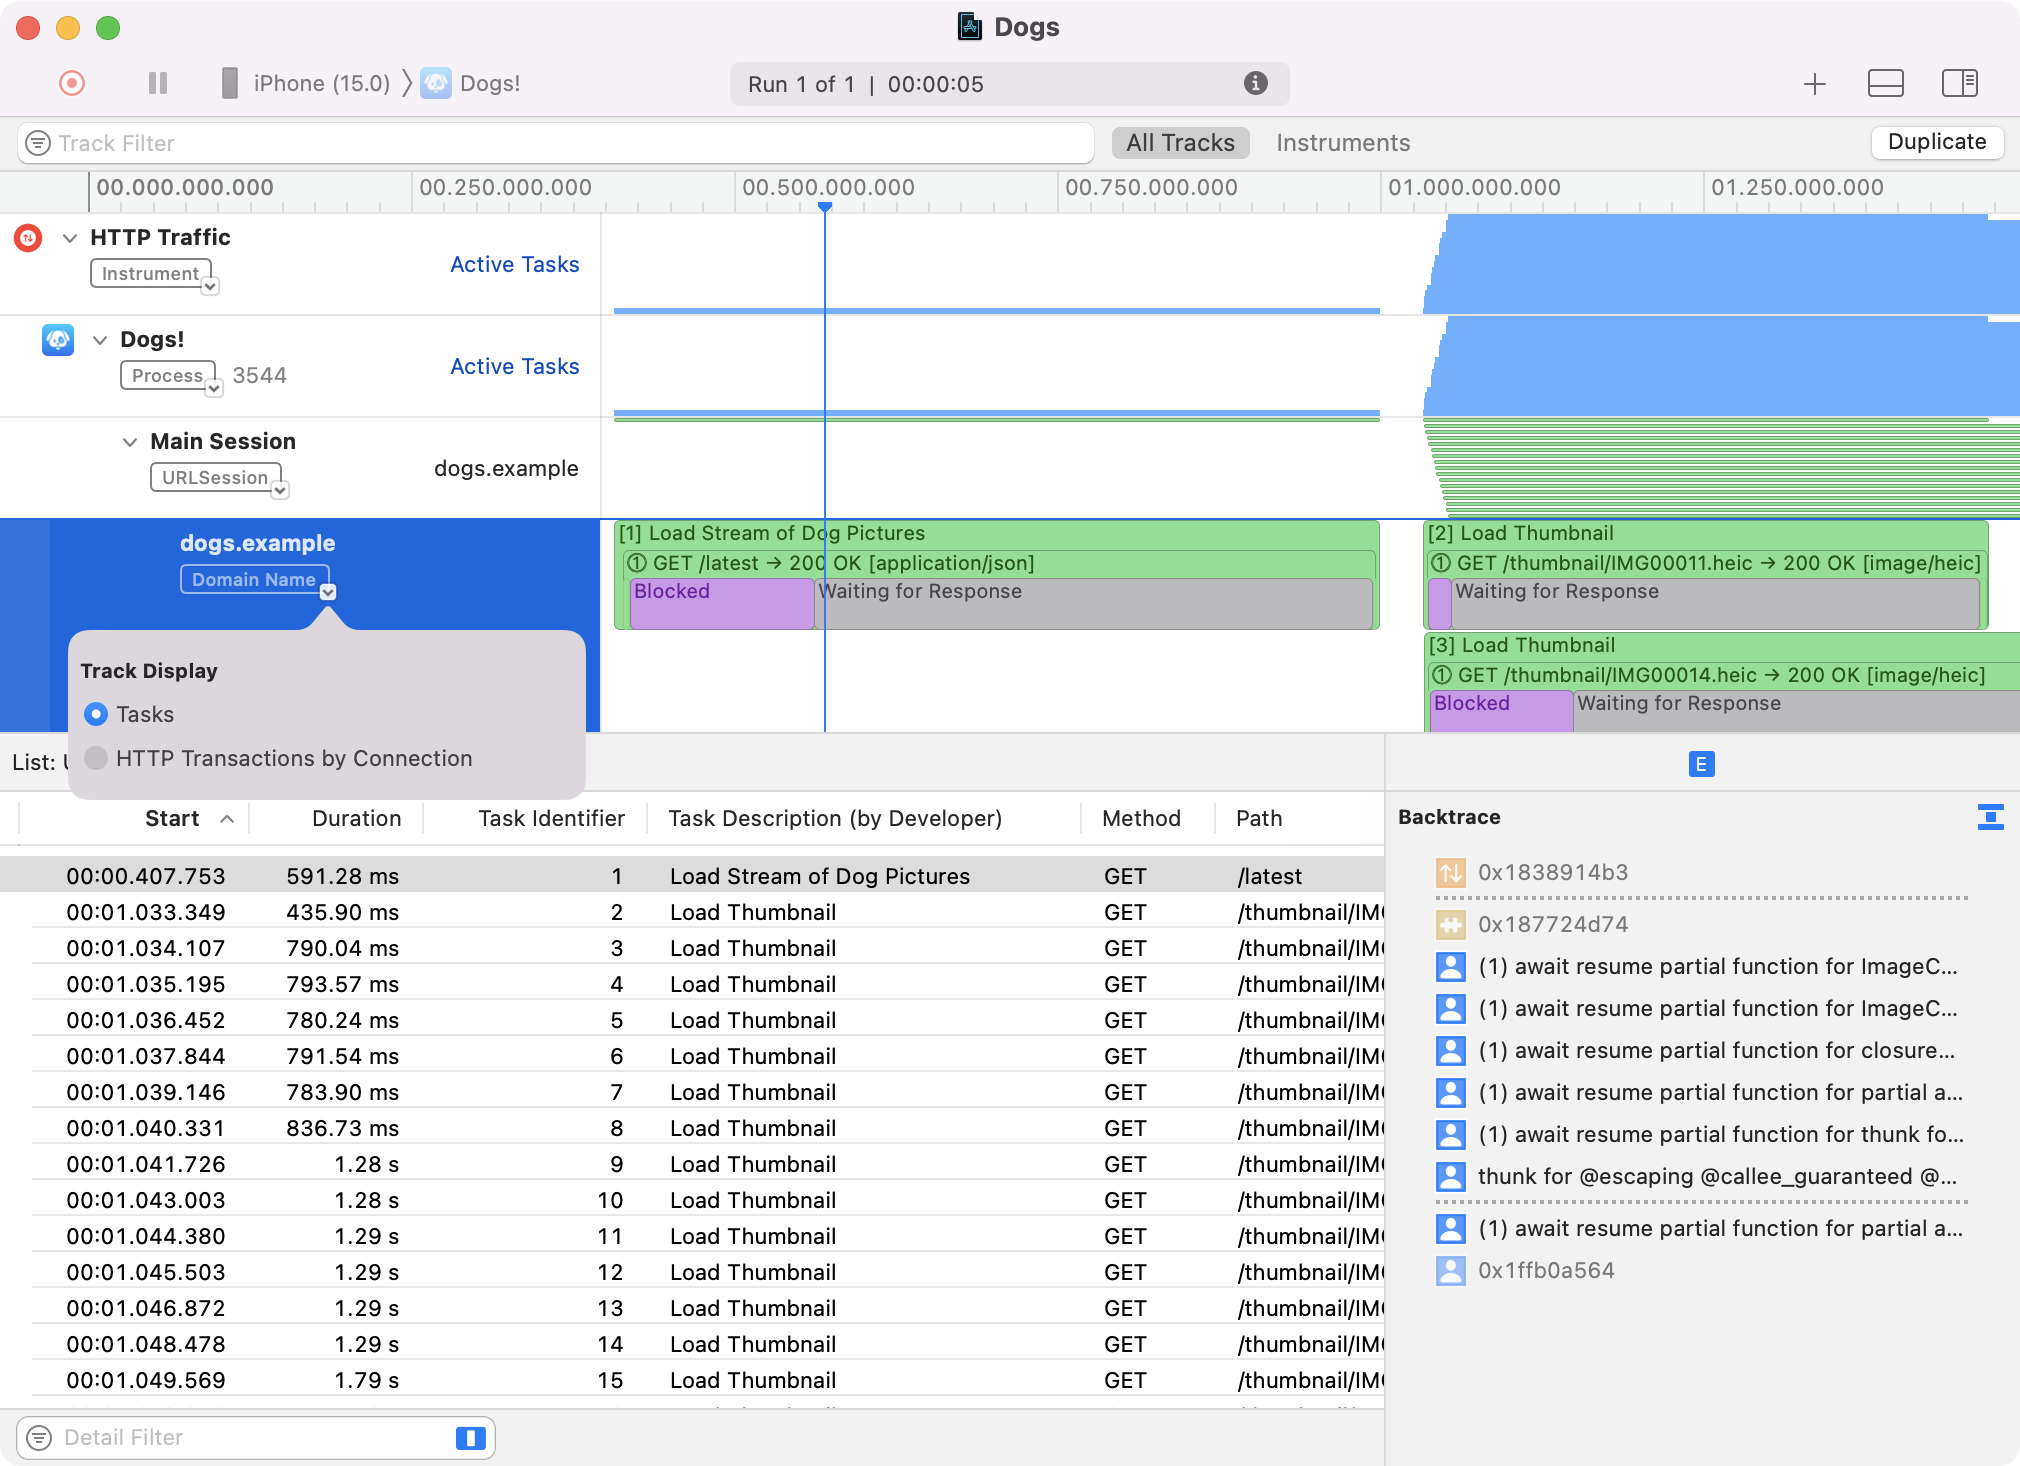
You can also display transactions grouped by connection. To switch to this style, click the arrow next to the domain name. This helps you understand how your transactions execute and the influence of the underlying connections. Here are the transactions grouped by connection.
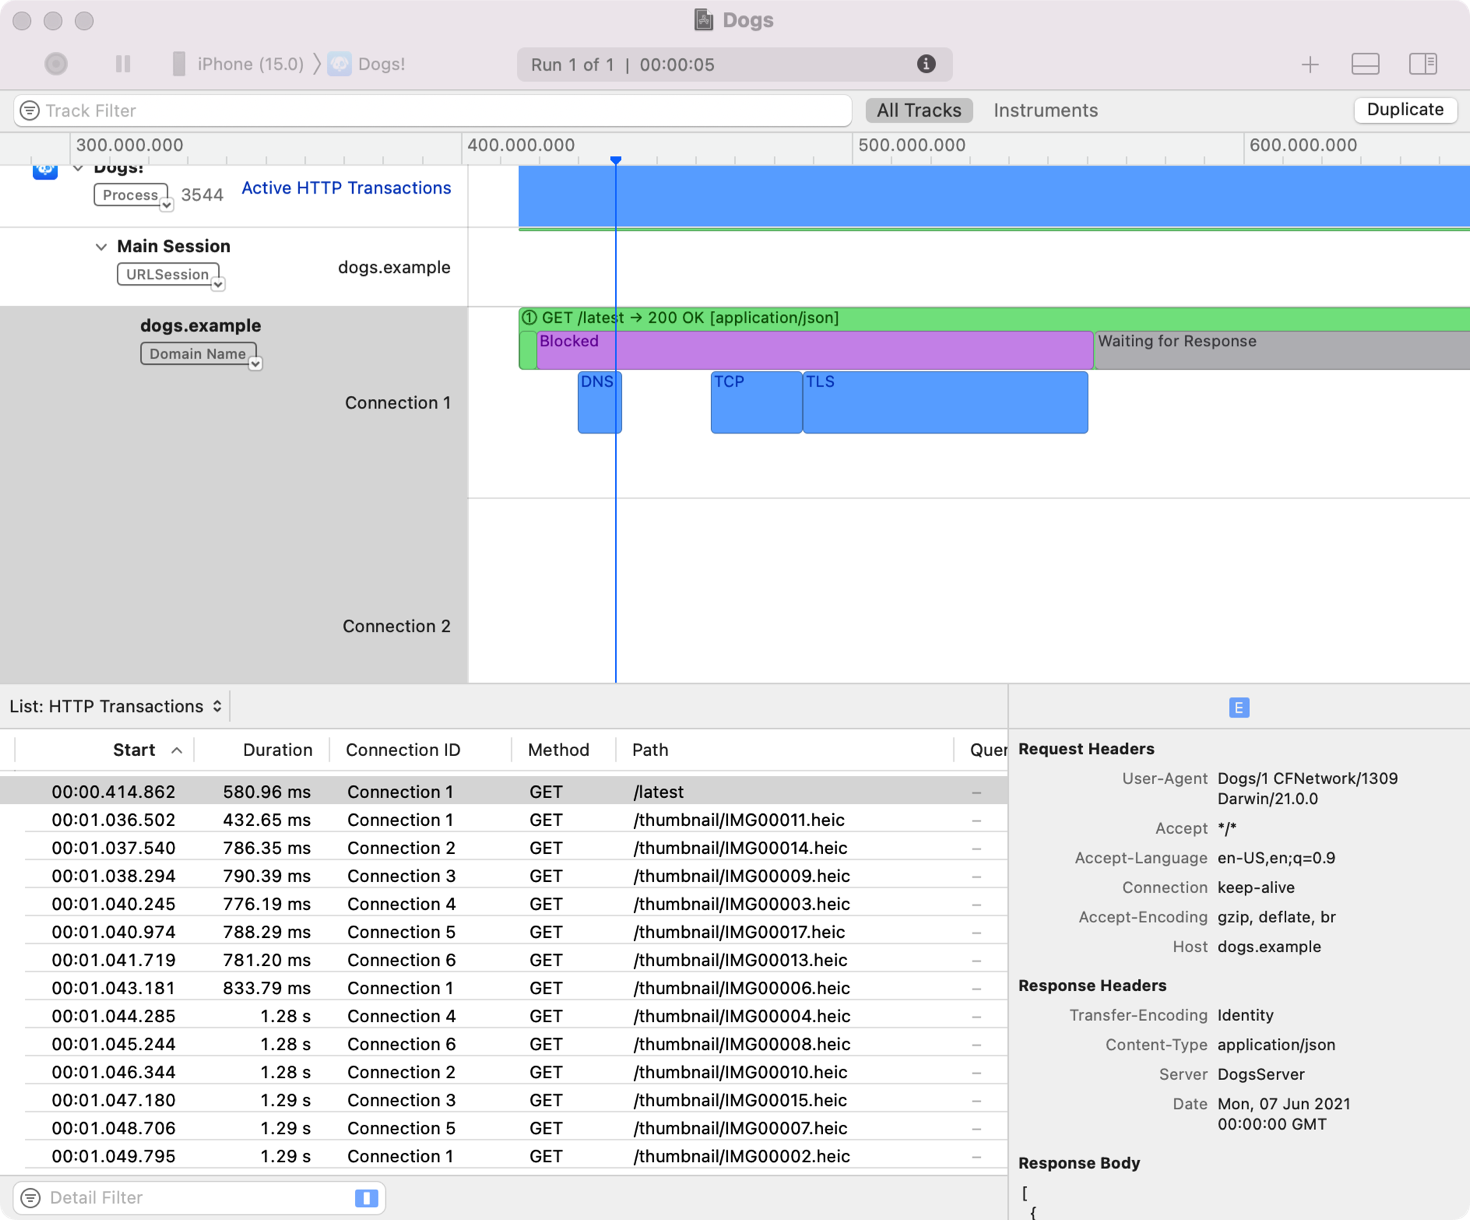
The detail pane and inspector update when you change the track display style. When selecting the Tasks display, the detail pane shows information about the tasks. The inspector shows the backtrace of when the selected task resumed.
When selecting the HTTP Transactions by Connection display, the detail pane shows information about the transactions. The inspector shows the request headers, response headers, and the request and response body of the selected transaction.
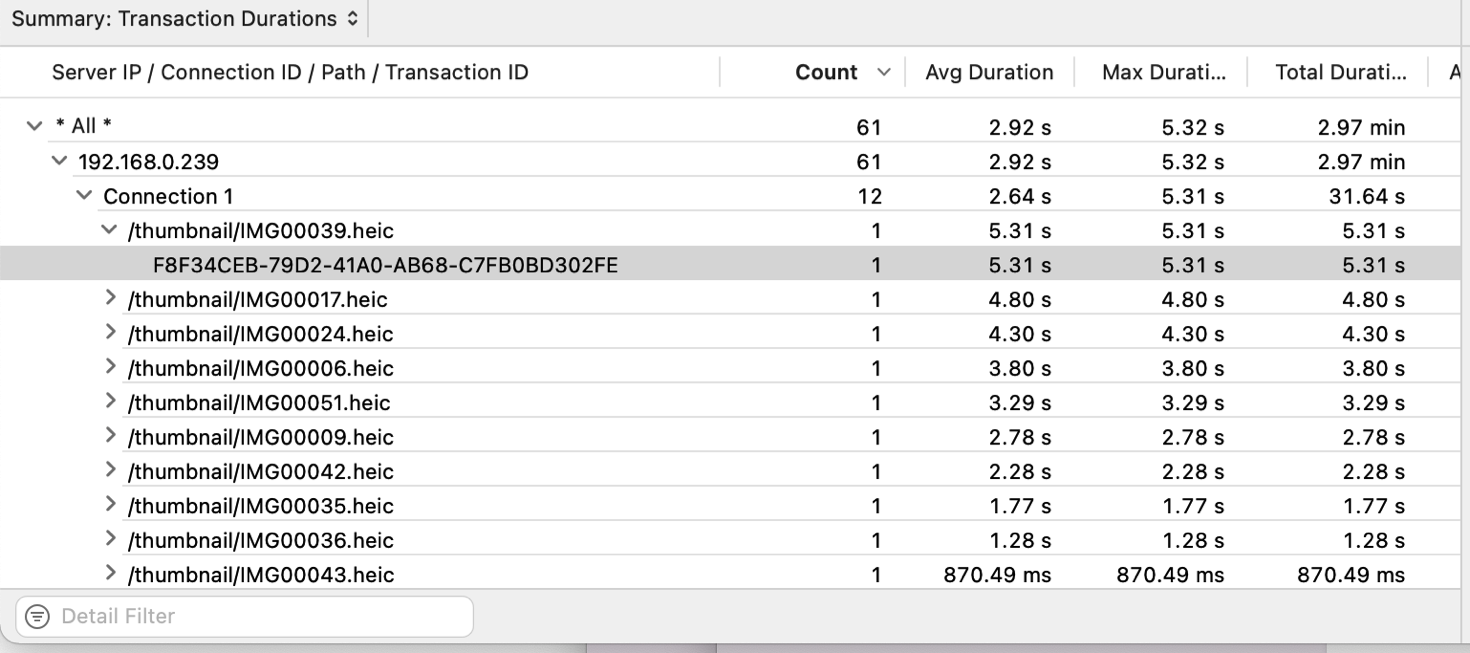
In addition to the two lists in the detail pane, there’s a summary view. From the pop-up menu, select “Summary: Transaction Durations.” The summary view groups connections hierarchically by IP address, connection, and path.
class URLSessionclass URLSessionTask